U.S. Household Income Rises as Poverty Falls in 2025, Census Data Shows
New Census Bureau data show stronger household incomes, a lower official poverty rate and largely stable health insurance coverage across the United States in 2025.

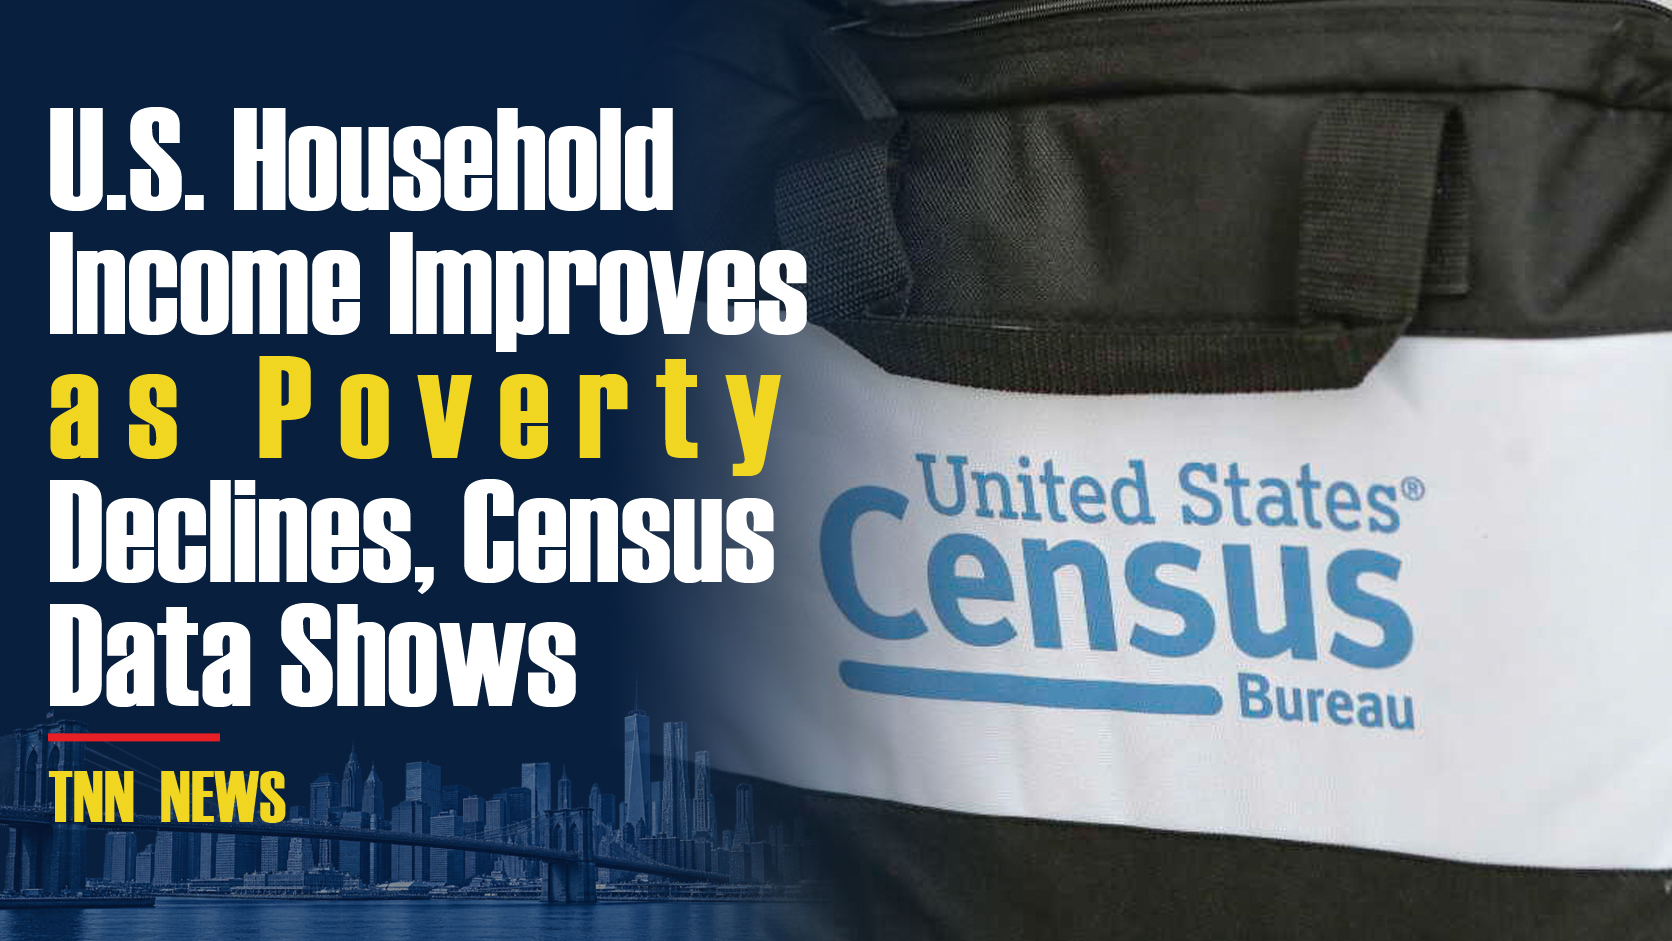
The latest U.S. Census Bureau figures provide a broad snapshot of how American households experienced changes in income, poverty and health coverage during 2025. Released on September 15, 2026, the data point to stronger household earnings alongside a modest reduction in official poverty, while the overall share of Americans without health insurance remained broadly unchanged.
The figures are drawn from the 2026 Current Population Survey Annual Social and Economic Supplement and are presented across three reports covering income, poverty and health insurance coverage in the United States. Taken together, they offer a useful measure of household economic conditions and the reach of the country’s public and private safety-net systems.
Household income recorded one of the clearest improvements. Real median household income rose 2.6% to $87,460 in 2025, compared with $85,210 in 2024. The Census Bureau identified the 2025 level as the highest median household income recorded since the series began in 1967.
The increase was also visible after taxes. Median post-tax household income climbed 3.1%, reaching $76,060 from $73,760 a year earlier. However, the post-tax measure remained below the unusually high levels recorded in 2020 and 2021, when federal stimulus payments and expanded tax credits provided additional support to households.
The distribution of those gains remains an important part of the economic picture. The Census Bureau found no statistically significant change in overall income inequality between 2024 and 2025, as measured by the Gini index. Income at the 10th percentile also showed no significant movement, while households at the 90th percentile experienced a 1.7% increase. This suggests that the rise in the national median did not represent an equally sized shift across every part of the income distribution.
Poverty indicators moved in a more favorable direction. The official poverty rate declined by 0.5 percentage points to 10.2%, leaving approximately 34.5 million people below the official poverty threshold. The decline was accompanied by particularly notable improvements among some demographic groups.
The child poverty rate fell to 13.4%, described by the Census Bureau as a historic low. The official poverty rate among Hispanic individuals also reached a historic low of 13.9%. These figures provide an important counterpoint to broader income statistics by showing that changes in economic conditions were not limited to aggregate household measures.
A different picture emerges from the Supplemental Poverty Measure. The SPM incorporates factors that are not included in the official poverty measure, including government benefits, taxes, work-related expenses, medical costs and geographic differences in housing expenses. The 2025 SPM rate was 13.1%, statistically unchanged from 2024.
Government programs therefore continued to play a substantial role in determining household economic outcomes. Social Security remained the largest antipoverty program measured through the SPM, with the Census Bureau estimating that it moved 28.8 million people out of poverty in 2025. The figure illustrates the scale at which public transfers can affect measured poverty even when underlying market income does not change at the same pace.
Health insurance coverage, meanwhile, showed greater stability than the income and poverty indicators. An estimated 26.7 million Americans, or 7.9% of the population, were uninsured for the entire year in 2025. The share was not statistically different from the 2024 level.
Employer-sponsored insurance continued to be the dominant source of coverage, reaching 53.5% of the population for some or all of the year. Medicare covered 20.1%, Medicaid covered 17.1%, and directly purchased insurance covered 10.5%. TRICARE accounted for 2.8%, while VA and CHAMPVA coverage represented 1.2%.
Public health insurance overall covered 35.8% of the population in 2025, with no statistically significant change from the previous year. Within that total, Medicare coverage increased by 0.6 percentage points, while Medicaid coverage decreased by 0.5 percentage points.
The movement in Medicaid was more visible among working-age adults. Public insurance coverage for adults aged 19 to 64 declined by 0.5 percentage points to 17.3%, largely because Medicaid coverage fell by 0.6 percentage points.
The Census Bureau connected the continued decline in Medicaid coverage with the normalization of eligibility and enrollment procedures following the end of pandemic-era continuous coverage requirements in 2023. The agency noted that Medicaid enrollment coverage had declined for the second consecutive year.
From a broader economic perspective, the 2025 data show an American household sector experiencing higher real median income while poverty moved lower, but they also highlight differences between headline improvements and the underlying distribution of economic resources. The record median income does not by itself indicate that all households experienced comparable gains, particularly given the limited movement at the lower end of the income distribution.
The health insurance figures similarly suggest continuity rather than a major structural shift. Employer-based coverage remains the central pillar of the U.S. insurance system, while public programs continue to cover a significant share of the population. Changes in Medicaid coverage are particularly relevant because they can alter the composition of the insured population even when the national uninsured rate remains relatively stable.
The Census Bureau’s release also provides estimates broken down by demographic characteristics and geographic areas, allowing policymakers, businesses and researchers to examine how these national trends differ across communities. For the private sector, such data can inform assessments of household purchasing power, consumer demand and regional economic conditions. For public institutions, they provide measures for evaluating poverty reduction, social programs and access to health coverage.
Overall, the 2025 figures present a mixed but clearly measurable shift in the economic profile of U.S. households: real median income reached a record level, official poverty declined, and health insurance coverage remained broadly stable. The combination offers a more detailed picture than any single indicator, showing both improvement in aggregate household income and continued differences in how economic gains and public support are distributed across the American population.
News You Should See
2026 Nobel Medicine Prize Honors Scientists Behind Optogenetics Breakthrough
Oil Prices Edge Lower as Stronger Middle East Exports and G7 Reserves Ease Supply Concerns
Trump Offers U.S. Assistance to Russia After Death at Siberian Plague Research Institute
Trump Takes Economic Message to Nebraska as GOP Faces Rising Cost-of-Living Pressure
U.S. Appeals Court Weighs Trump Administration’s $2.6 Billion Harvard Funding Fight
U.S. Midterm Elections Begin With Resilient Jobs Market and Persistent Cost Pressures
Latest News
The 2026 Nobel Prize in Physiology or Medicine honors Karl Deisseroth, Peter Hegemann and Georg Nagel for pioneering research behind optogenetics and its impact on neuroscience.
Oil prices edged lower as stronger Middle Eastern exports and a planned G7 release of 100 million barrels eased immediate supply concerns, while Gulf security risks and the Strait of Hormuz kept markets alert.
President Donald Trump said the United States would help Russia if needed after a laboratory worker died at a Siberian plague research institute, as Russian authorities imposed precautionary quarantine measures.
Trump’s Nebraska campaign stop highlights rising fuel and grocery costs, beef prices and growing economic pressure on Republicans ahead of the November midterm elections.
A U.S. appeals court is reviewing the Trump administration’s effort to cut Harvard’s federal research funding, with more than $2.6 billion at stake.
The U.S. enters the 2026 midterm elections with unemployment at 4.2%, while higher living and energy costs create economic pressure for households and businesses.
US services growth eased in September as input prices climbed to their highest level since July 2022, with fuel costs, supply-chain disruptions and strong demand increasing pressure on businesses.
Rising Treasury yields are increasing U.S. borrowing costs as Washington manages record debt, persistent inflation and strong economic demand, narrowing its policy options.
A EGP 16 million corporate partnership will establish and equip a bone marrow transplant unit at Cairo’s Coptic Hospital, supporting access to specialized treatment for patients.